Salaries in Milpitas, CA

Updated on Mar 08, 2025
City
Salary

What is the average salary in Milpitas, CA?

The average salary in Milpitas, CA is $75,001 per year.

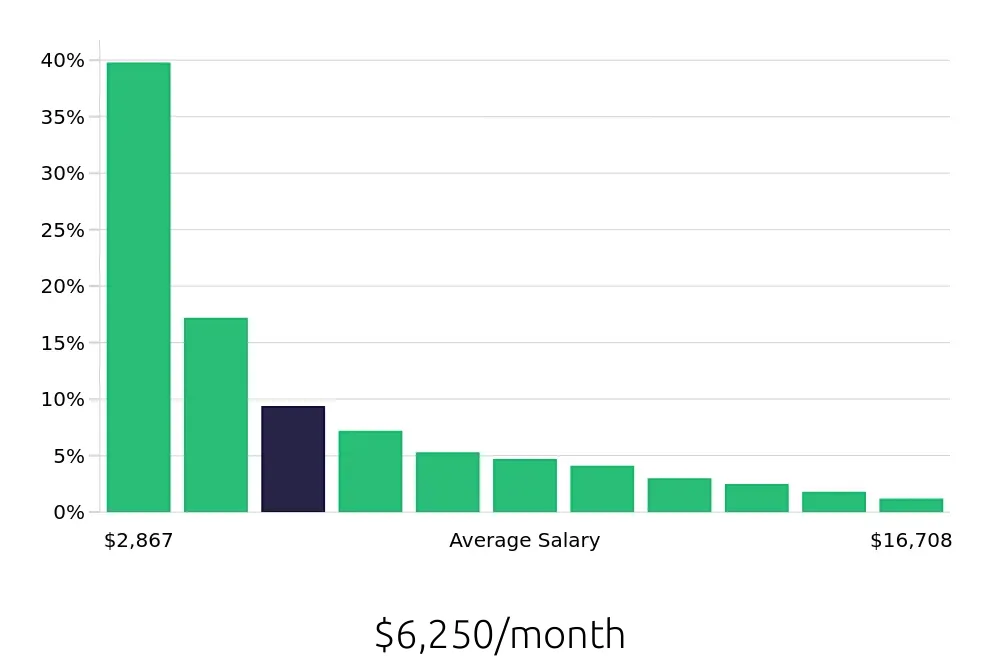
In Milpitas, CA, the job market offers a variety of salaries that cater to different skill levels and experiences. The average yearly salary stands at a solid $75,001, indicating a healthy job market for professionals.


A significant portion of the workforce earns salaries around $34,400, which accounts for 39.7% of jobs. Increasing in salary, about 17.1% earn around $49,500. As experience grows, salaries continue to rise, with 9.3% of roles paying $64,600 and 7.1% offering $79,700.


Salaries reach up to $94,800 for 5.2% of positions, while others pay $109,900 (4.6%) and $125,000 (4.0%). For those in senior roles, larger salaries become common, with 2.9% receiving $140,100, 2.4% earning $155,200, 1.7% at $170,300, 1.1% at $185,400, and up to $200,500 for a few elite positions.


This range of salaries shows that Milpitas, CA, provides lucrative opportunities for job seekers at various stages in their careers. As you explore possibilities here, consider how your skills and experience match roles to maximize your earning potential.

View Jobs in Milpitas, CA

What are the best paying jobs in Milpitas, CA?

The top paying jobs in Milpitas, CA, offer impressive salaries that reflect the demand for skilled professionals. Roles such as Research Associate and Software Engineer lead the pack, with average salaries around $152,587 and $136,060, respectively. Other high-paying positions include Electrical Engineer and Marketing Manager, earning approximately $131,298 and $123,256. With opportunities in various fields like engineering and healthcare, job seekers can find lucrative careers in this thriving city.
Graph displaying best paying job salaries in Milpitas, CA, highlighting Research Associate with the highest at $152,587 and Speech Language Pathologist with the lowest at $107,120.
  1. Research Associate
    Average Salary: $152,587
    In this role, you will conduct experiments and analyze data to support advanced projects in life sciences. Companies in the region, such as Seagate Technology and Cisco, often seek skilled individuals to contribute to innovative research efforts. Your work can lead to groundbreaking discoveries that impact healthcare and technology.
    Find Research Associate jobs in Milpitas, CA


  2. Software Engineer
    Average Salary: $136,060
    As a software engineer, you will design and develop software applications that meet user needs. Firms like Cisco and Broadcom hire talented engineers to enhance their digital solutions. This job offers opportunities to work on exciting projects that shape the future of technology.
    Find Software Engineer jobs in Milpitas, CA


  3. Electrical Engineer
    Average Salary: $131,298
    Electrical engineers in this area design and improve electronic systems for various industries, including telecommunications. Companies like Juniper Networks look for creative minds to advance their product lines. Your skills in circuit design and testing will contribute significantly to high-tech developments.
    Find Electrical Engineer jobs in Milpitas, CA


  4. Marketing Manager
    Average Salary: $123,256
    In this position, you will create and implement marketing strategies to promote products and services effectively. Businesses such as Western Digital need strategic marketers to boost their brand presence. You will analyze market trends to ensure successful campaigns and engage customers.
    Find Marketing Manager jobs in Milpitas, CA


  5. Application Engineer
    Average Salary: $121,095
    Application engineers work closely with customers to tailor software solutions to their specific needs. You will collaborate with development teams at companies like Intel to ensure product functionality aligns with user requirements. Your technical expertise will drive customer satisfaction and product success.
    Find Application Engineer jobs in Milpitas, CA


  6. Mechanical Engineer
    Average Salary: $118,253
    This role involves designing and developing mechanical systems and components for various applications. Firms such as Tesla require mechanical engineers to innovate in automotive design and manufacturing. You will troubleshoot designs and improve processes to enhance product quality.
    Find Mechanical Engineer jobs in Milpitas, CA


  7. Manufacturing Engineer
    Average Salary: $116,381
    Manufacturing engineers enhance production processes by integrating technology and developing efficient workflows. Companies like Flex seek your skills to improve their assembly lines and reduce costs. You will work on problem-solving initiatives that drive productivity and enhance product quality.
    Find Manufacturing Engineer jobs in Milpitas, CA


  8. School Psychologist
    Average Salary: $110,991
    As a school psychologist, you will work with students to help with academic and emotional challenges. Local schools value professionals who can provide assessments and develop interventions to support student wellbeing. Your role will positively impact the lives of children and their educational experiences.
    Find School Psychologist jobs in Milpitas, CA


  9. Engineer
    Average Salary: $107,842
    Engineers in various disciplines play a key role in developing solutions for technical challenges across industries. Companies such as KLA-Tencor seek engineers to work on cutting-edge technologies. Your contributions will help advance projects that shape the future of the industry.
    Find Engineer jobs in Milpitas, CA


  10. Speech Language Pathologist
    Average Salary: $107,120
    This role focuses on helping individuals improve their communication and swallowing abilities. Clinics and schools in the area require skilled professionals to work with diverse populations. Your expertise will support clients in achieving better communication skills, enhancing their quality of life.
    Find Speech Language Pathologist jobs in Milpitas, CA

What are the best paying jobs in Milpitas, CA without a degree?

In Milpitas, some of the best paying jobs that do not require a degree include roles such as Irrigation Technician, which offers an average salary of $60,000, and Swimming Pool Service Technician, averaging about $46,433. Other rewarding positions include Loader and Meat Cutter, with salaries ranging from approximately $42,000 to $44,000, making these opportunities attractive for job seekers looking to earn a solid income without formal education.
Graph displaying best paying job salaries in Milpitas, CA without a degree, highlighting Irrigation Technician with the highest at $60,000 and Server with the lowest at $35,483.
  1. Irrigation Technician
    Average Salary: $60,000
    This role involves managing and maintaining irrigation systems to ensure optimal water usage. Professionals work with various types of equipment and often assist landscaping companies in the area. Companies like Granit States and Advanced Irrigation Systems often seek skilled technicians.
    Find Irrigation Technician jobs in Milpitas, CA


  2. Swimming Pool Service Technician
    Average Salary: $46,433
    In this position, individuals maintain and repair swimming pools, ensuring they are clean and safe for users. The job includes balancing chemicals and cleaning debris from pools. Local businesses, such as Blue Haven Pools and Anthony & Sylvan Pools, continuously look for dedicated technicians.
    Find Swimming Pool Service Technician jobs in Milpitas, CA


  3. Loader
    Average Salary: $44,354
    Loaders play a vital role in warehouses or shipping facilities by loading and unloading goods from trucks. Attention to detail and physical stamina are essential in this fast-paced job. Companies like FedEx and UPS often hire loaders for their distribution centers.
    Find Loader jobs in Milpitas, CA


  4. Meat Cutter
    Average Salary: $42,304
    This position requires cutting, trimming, and preparing meat for sale. Professionals ensure all products meet health and safety standards while providing quality service to customers. Local grocery chains and butcher shops regularly seek experienced meat cutters.
    Find Meat Cutter jobs in Milpitas, CA


  5. Line Cook
    Average Salary: $41,103
    Line cooks prepare food in restaurants, following recipes and ensuring meals are ready on time. They collaborate closely with the kitchen team to deliver quality dishes. Many restaurants in Milpitas, like The Cheesecake Factory and Mama Mia's, look for skilled line cooks.
    Find Line Cook jobs in Milpitas, CA


  6. Housekeeping
    Average Salary: $39,619
    Housekeepers maintain cleanliness in hotels and other establishments. They ensure guest rooms are tidy and comfortable, often working independently or as part of a larger team. Hotels such as the Hilton and Marriott frequently hire housekeepers to create a welcoming environment.
    Find Housekeeping jobs in Milpitas, CA


  7. Barista
    Average Salary: $38,879
    Baristas prepare and serve coffee beverages, creating a friendly and enjoyable atmosphere for customers. They often engage with patrons and handle cash transactions. Coffee shops like Starbucks and Peet's Coffee in Milpitas seek enthusiastic individuals for this role.
    Find Barista jobs in Milpitas, CA


  8. Server Assistant
    Average Salary: $37,977
    In this role, individuals support servers by ensuring tables are clean and ready for customers. They help with various tasks to enhance the dining experience. Many local restaurants and eateries look for reliable server assistants to join their teams.
    Find Server Assistant jobs in Milpitas, CA


  9. Dishwasher
    Average Salary: $35,895
    Dishwashers clean dishes, utensils, and cooking equipment in restaurants or kitchens. They play a critical role in maintaining hygiene and supporting kitchen staff. Establishments like local diners and fast-food chains often seek dedicated dishwashers.
    Find Dishwasher jobs in Milpitas, CA


  10. Server
    Average Salary: $35,483
    Servers take orders and deliver food in restaurants, providing hosts with a pleasant dining experience. They often interact with customers, ensuring satisfaction and addressing any needs. Many popular dining spots in Milpitas, like Denny's and Olive Garden, are on the lookout for motivated servers.
    Find Server jobs in Milpitas, CA

Which companies offer the top salaries in Milpitas, CA?

The best paying companies in Milpitas, CA, include Western Digital and KLA-Tencor, with average salaries of approximately $144,141 and $143,292, respectively. Other well-paying employers in the area are Renesas and KLA Corporation, offering average salaries around $138,658 and $134,610. Overall, job seekers can find competitive salaries across various industries in Milpitas.
Graph displaying company salaries in Milpitas, CA, highlighting Western Digital with the highest at $144,141 and Sagent Management with the lowest at $93,877.
  1. Western Digital
    Average Salary: $144,141
    Western Digital is a leading data storage company that designs and produces innovative storage solutions.


  2. KLA-Tencor
    Average Salary: $143,292
    KLA-Tencor provides process control and yield management solutions for the semiconductor industry.


  3. Renesas
    Average Salary: $138,658
    Renesas is a global semiconductor company that specializes in microcontrollers and advanced solutions.


  4. KLA Corporation
    Average Salary: $134,610
    KLA Corporation develops advanced inspection and measurement systems for the semiconductor manufacturing process.


  5. CITY OF MILPITAS
    Average Salary: $110,731
    The City of Milpitas offers various public services and infrastructure development to improve community welfare.


  6. Envision Motors
    Average Salary: $104,447
    Envision Motors focuses on electric vehicle manufacturing and related technology solutions.


  7. Auriga Corporation
    Average Salary: $100,245
    Auriga Corporation specializes in software and information technology services for various industries.


  8. ProCare Therapy
    Average Salary: $99,974
    ProCare Therapy provides staffing solutions and therapy services for schools and educational institutions.


  9. SERES
    Average Salary: $98,632
    SERES is an automotive company focusing on electric vehicles and smart mobility solutions.


  10. Sagent Management
    Average Salary: $93,877
    Sagent Management offers financial advisory and asset management services to various sectors.

How does the cost of living in Milpitas, CA compare to the national average?

Milpitas, CA has a higher cost of living index compared to the nationwide average, which stands at 100. Specifically, its overall index is approximately 205%, making it significantly more expensive, especially in areas like housing and groceries.
Cost of living comparison graph for Milpitas, CA vs. Nationwide: housing 205% higher, groceries 20% higher, utilities 10% higher, transportation 20% higher, healthcare 5% higher, miscellaneous 12% higher.

Milpitas, CA, presents a cost of living index significantly higher than the nationwide average of 100. Housing is the major contributor to this higher index, sitting at 305, which indicates that living expenses related to housing are 205% above the national average. This steep housing cost reflects the area's popularity and demand, making it an essential factor for professional job seekers to consider.


Other categories also show increased costs. Groceries in Milpitas operate at a cost index of 120, which is 20% above the national average. Utilities and transportation also contribute to higher living expenses, with indexes of 110 and 120, respectively. Healthcare costs are somewhat more manageable, with an index of 105, only 5% over the national average. Meanwhile, miscellaneous expenses add a small additional burden at 112, or 12% higher than the nationwide statistics. Overall, job seekers should evaluate these costs carefully while considering opportunities in Milpitas, as it provides a vibrant economy and job market, tempered by higher living expenses.

Compare Salaries

What are other cities like?
Compare different cities.
Select a city
Thank you! Your submission has been received!
Oops! Something went wrong while submitting the form.
a hand paying employees
Pasadena, TX
Pasadena, TX has a cost of living index of 92, which is 8% lower than the nationwide average of 100. This means residents enjoy lower costs in housing, groceries, and transportation compared to other areas in the country.
Learn more
Pearland, TX
The cost of living index in Pearland, TX is 98, which is 2% lower than the nationwide average of 100. This means that living in Pearland can be more affordable compared to many other areas in the country.
Learn more
Pembroke Pines, FL
Pembroke Pines, FL has a cost of living index of 107, which is 7% higher than the nationwide average of 100. The most significant factor is housing, at 125, making it relatively more expensive in this category.
Learn more
Pflugerville, TX
Pflugerville, TX has a cost of living index of 93, which is 7% lower than the nationwide average of 100. This makes Pflugerville a more affordable option for professionals seeking a balanced lifestyle.
Learn more
Pinellas Park, FL
Pinellas Park, FL has a cost of living index of 96, which is 4% lower than the nationwide average of 100. This makes it an affordable option compared to many other areas in the country.
Learn more
Plano, TX
The cost of living index in Plano, TX is 103, which is 3% higher than the nationwide average of 100. Most categories, like housing at 9% above average, contribute to this increase while groceries and healthcare remain below the national average.
Learn more
Plantation, FL
Plantation, FL has a cost of living index of 103, which is 3% higher than the nationwide average of 100. This means living in Plantation is a bit more expensive than the average across the United States.
Learn more
Pomona, CA
The cost of living index in Pomona, CA is 115, which is 15% higher than the nationwide average of 100. This means residents may expect to pay more for housing, groceries, utilities, transportation, and healthcare compared to other areas in the country.
Learn more
Pompano Beach, FL
Pompano Beach, FL has a cost of living index of 102. This is 2% higher than the nationwide average of 100.
Learn more
Puyallup, WA
Puyallup, WA has a cost of living index of 102.5, which is 2.5% higher than the nationwide average of 100. This indicates that living in Puyallup is slightly more expensive than the average U.S. city.
Learn more
Quincy, MA
Quincy, MA has a cost of living index of 117, which is 17% higher than the nationwide average of 100. Housing costs lead the way, being 30% higher than average, while healthcare remains on par with the national figures.
Learn more
Rancho Cordova, CA
The cost of living index in Rancho Cordova, CA is 119, which is 19% higher than the nationwide average of 100. This means that living expenses in Rancho Cordova can be higher, especially in areas like housing and groceries.
Learn more
Redmond, WA
Redmond, WA has a cost of living index of 130, which is 30% higher than the nationwide average of 100. This means that living in Redmond is more expensive, particularly in housing and miscellaneous expenses.
Learn more
Renton, WA
The cost of living index in Renton, WA is 108, which is 8% higher than the nationwide average of 100. This means residents pay more for housing and groceries but benefit from lower utility costs compared to the national average.
Learn more
Richardson, TX
Richardson, TX has a cost of living index of 99, which is 1% below the nationwide average of 100. This means living in Richardson is slightly more affordable, especially in areas like housing and transportation.
Learn more
Riverside, CA
The cost of living index in Riverside, CA is 123, which is 23% higher than the nationwide average of 100. This suggests that living in Riverside can be more expensive, particularly in housing and transportation.
Learn more
Roseville, CA
The cost of living index in Roseville, CA is 114, indicating it is 14% higher than the nationwide average of 100. This reflects higher housing, grocery, and transportation costs compared to most other places in the country.
Learn more
Round Rock, TX
Round Rock, TX has a cost of living index of 94, which is 6% lower than the nationwide average of 100. This makes it an affordable option for those looking to relocate.
Learn more
Sacramento, CA
Sacramento, CA has a cost of living index of 117, which is 17% higher than the nationwide average of 100. This increase reflects higher housing and utility costs, making Sacramento more expensive than many other cities in the U.S.
Learn more
Sammamish, WA
Sammamish, WA has a cost of living index of 145.1, which is 45.1% higher than the nationwide average of 100. This difference highlights the relatively higher expenses residents face in housing, groceries, and other categories compared to most places in the country.
Learn more
San Antonio, TX
San Antonio, TX has a cost of living index of 92, which is 8% lower than the nationwide average of 100. This makes San Antonio an affordable option for those looking to live in a large city.
Learn more
San Diego, CA
San Diego, CA, has a cost of living index of 132, which is 32% higher than the nationwide average of 100. This increase reflects higher expenses in housing, groceries, and transportation compared to other areas in the country.
Learn more
San Jose, CA
San Jose, CA has a cost of living index of 134.2, which is 34.2% higher than the nationwide average of 100. This makes it important for job seekers to consider the higher expenses when looking for positions in this city.
Learn more
San Marcos, CA
San Marcos, CA has a cost of living index of 115, which is 15% higher than the nationwide average of 100. This means residents can expect to pay more for housing, groceries, and other expenses compared to the rest of the country.
Learn more
San Marcos, TX
San Marcos, TX has a cost of living index of 94.6, which is 5.4% lower than the nationwide average of 100. This lower index means that living expenses in San Marcos are generally more affordable than the national standard.
Learn more
Sanford, FL
The cost of living index in Sanford, FL is 7% lower than the nationwide average, which is set at 100. This offers residents an affordable lifestyle compared to many other areas in the country.
Learn more
Santa Clara, CA
Santa Clara, CA has a cost of living index of 145, which is 45% higher than the nationwide average of 100. This means living in Santa Clara can be more expensive, particularly for housing and groceries.
Learn more
Santa Clarita, CA
The cost of living index in Santa Clarita, CA is 130%, which is 30% higher than the nationwide average of 100. Housing costs make up the biggest difference, sitting at 70% above the national average.
Learn more
Schertz, TX
Schertz, TX has a cost of living index of 93.9, which is 6.1% lower than the nationwide average of 100. This makes Schertz an affordable option for those considering relocation.
Learn more
Seattle, WA
Seattle, WA has a cost of living index of 121. This is 21% higher than the nationwide average of 100.
Learn more
Shoreline, WA
Shoreline, WA has a cost of living index of 115, which is 15% higher than the nationwide average of 100. This means residents may spend more on housing, groceries, and transportation compared to the rest of the country.
Learn more
Somerville, MA
Somerville, MA has a cost of living index of 130.8, which is 30.8% higher than the nationwide average of 100. While housing costs are significantly above average at 58.5% more, other categories like groceries and healthcare also show higher expenses.
Learn more
Spokane Valley, WA
Spokane Valley, WA has a cost of living index of 95, which is 5% lower than the nationwide average of 100. This means housing, groceries, and transportation are more affordable, making it an attractive option for job seekers.
Learn more
Spokane, WA
Spokane, WA has a cost of living index of 95, which is 5% lower than the nationwide average of 100. This makes it an affordable option for those looking to relocate while pursuing job opportunities.
Learn more
Springfield, MA
Springfield, MA has a cost of living index of 91, which is 9% lower than the nationwide average of 100. This means residents enjoy lower housing and living costs compared to many other areas in the country.
Learn more
Sugar Land, TX
The cost of living index in Sugar Land, TX stands at 103, which is 3% higher than the nationwide average of 100. Housing costs are notably higher at 17%, while groceries and transportation are below average.
Learn more
Sunnyvale, CA
The cost of living index in Sunnyvale, CA is 157, which is 57% higher than the nationwide average of 100. This means residents face higher expenses for housing, groceries, and other necessities compared to most other areas in the country.
Learn more
Tacoma, WA
The cost of living index in Tacoma, WA is 115, which is 15% higher than the nationwide average of 100. This increase mainly comes from higher housing and transportation costs.
Learn more
Tallahassee, FL
The cost of living index in Tallahassee, FL is 92.5, which is 7.5% lower than the nationwide average of 100. This makes Tallahassee an affordable option for those considering relocation.
Learn more
Tampa, FL
Tampa, FL has a cost of living index of 100.6, which is slightly above the nationwide average of 100, indicating a more affordable cost for housing, utilities, and healthcare compared to other areas in the country.
Learn more
The Colony, TX
The cost of living index in The Colony, TX is 1% below the nationwide average, scoring 99 overall. This means residents enjoy a more affordable lifestyle compared to many other parts of the country.
Learn more
The Woodlands, TX
The Woodlands, TX, has a cost of living index of 98, which is 2% lower than the nationwide average of 100. This makes it a more affordable option for professional job seekers looking to relocate.
Learn more
Torrance, CA
Torrance, CA has a cost of living index of 130, which is 30% higher than the nationwide average of 100. This reflects increased costs in housing, groceries, and transportation compared to other areas across the country.
Learn more
Tukwila, WA
Tukwila, WA has a cost of living index of 106, which is 6% higher than the nationwide average of 100. Housing costs are notably higher at 32% above average, while utilities remain lower than average at 2% less.
Learn more
Vancouver, WA
Vancouver, WA has a cost of living index of 106, which is 6% higher than the nationwide average of 100. This indicates that living in Vancouver is relatively more expensive than the average in the U.S.
Learn more
Vista, CA
The cost of living index in Vista, CA is 118.4, which is 18.4% higher than the nationwide average of 100. This highlights the higher expenses residents can expect in housing, groceries, and healthcare compared to other parts of the country.
Learn more
Westfield, MA
The cost of living index in Westfield, MA stands at 99, which is 1% lower than the nationwide average of 100. This means that overall, living in Westfield is slightly more affordable compared to the national level.
Learn more
Weston, FL
Weston, FL has a cost of living index of 115, which is 15% higher than the nationwide average of 100. This increase is mainly driven by higher housing costs, which are 40% above the national average.
Learn more
Worcester, MA
Worcester, MA has a cost of living index of 94, which is 6% lower than the nationwide average of 100. This lower index indicates that living expenses in Worcester are generally more affordable compared to many other places in the country.
Learn more

There are 628 job openings in Milpitas, CA, today!

Take a deeper dive into the job market in Milpitas, CA

Discover what it's like to work in Milpitas, CA. Learn if you need a car, explore popular employers, the job market, and the best neighborhoods to live in.

City
Overview
Milpitas, CA
628 job openings