Salaries in Riverside, CA

Updated on Mar 08, 2025
City
Salary

What is the average salary in Riverside, CA?

The average salary in Riverside, CA is $79,399 per year.

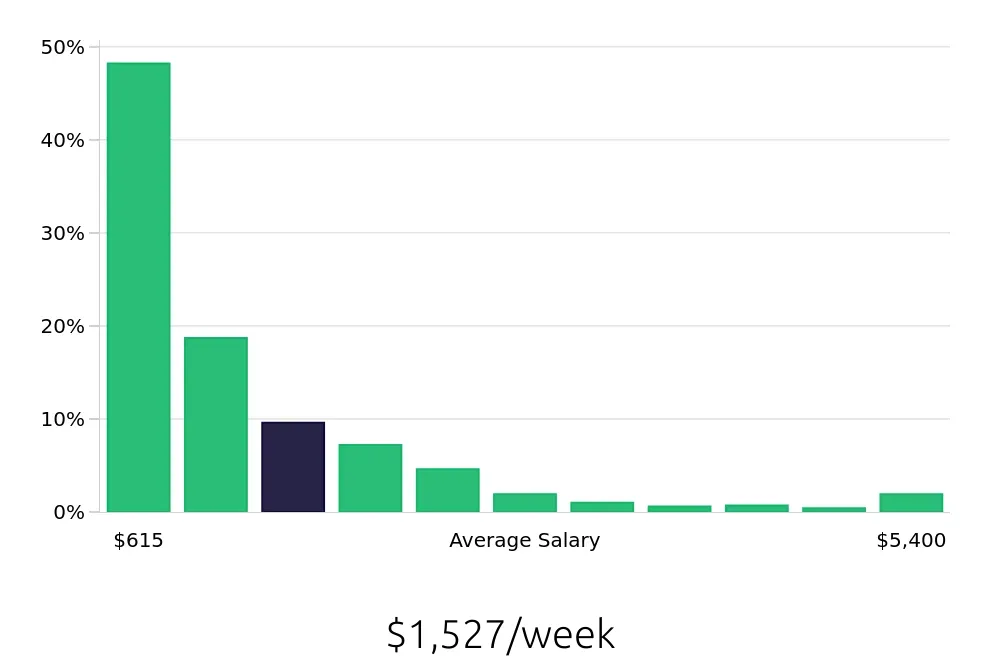
In Riverside, CA, the salary landscape offers a range of opportunities for job seekers. The average yearly salary stands at $79,399, providing a solid living for many residents. The distribution of salaries shows that a large portion of people, about 48.2%, earn around $32,000, indicating entry-level positions are prevalent. As skills and experience grow, earning potential increases significantly. For example, 18.7% of individuals earn around $54,618, while 9.6% earn about $77,236. Those with more experience or specialized skills can earn higher salaries, reaching $99,855 for 7.2% of workers, and up to $122,473 for 4.6%. Top earners, making above $145,091, account for smaller percentages, with salaries soaring beyond $200,000. This salary range reflects a healthy job market that rewards education and experience, making Riverside a promising place for career growth.

View Jobs in Riverside, CA

What are the best paying jobs in Riverside, CA?

The best paying jobs in Riverside, CA, offer substantial salaries across various fields. Top earners include psychiatrists, with an impressive average salary of $380,362, and physicians at $294,371. Other notable professions include general dentists and unit managers, earning average salaries of $266,871 and $157,112 respectively. Positions in healthcare, like nurse practitioners and physician assistants, also provide competitive pay, making Riverside an attractive location for skilled professionals.
Graph displaying best paying job salaries in Riverside, CA, highlighting Psychiatrist with the highest at $380,362 and Attorney with the lowest at $128,813.
  1. Psychiatrist
    Average Salary: $380,362
    Mental health plays a vital role in the community, and medical professionals focus on understanding and treating such conditions. Local healthcare facilities like Riverside University Health System and private practices seek skilled individuals to provide excellent care. The demand for qualified professionals is high, ensuring rewarding opportunities in the field.
    Find Psychiatrist jobs in Riverside, CA


  2. Physician
    Average Salary: $294,371
    Healthcare providers play a crucial role in ensuring the well-being of residents. Many local hospitals, including Riverside Community Hospital, offer various specialties and require experienced professionals. These positions provide not only high salaries but also the chance to make a significant impact on patients' lives.
    Find Physician jobs in Riverside, CA


  3. General Dentist
    Average Salary: $266,871
    Dentists in the region focus on oral health and preventive care, improving the quality of life for many residents. With practices often affiliated with health networks like Kaiser Permanente, skilled individuals find ample opportunities to grow their careers. The combination of a strong patient base and local demand contributes to high earning potential.
    Find General Dentist jobs in Riverside, CA


  4. Unit Manager
    Average Salary: $157,112
    Management positions in healthcare facilities lead teams that provide essential patient care. Facilities like Riverside Medical Clinic seek individuals who can oversee operations, ensuring high-quality services. This role combines leadership with impactful patient interaction, creating a rewarding career for qualified professionals.
    Find Unit Manager jobs in Riverside, CA


  5. Solar Sales Representative
    Average Salary: $154,714
    As the push for renewable energy grows, sales representatives educate homeowners about solar solutions. Companies in the area focus on sustainability and energy efficiency, opening up lucrative opportunities for those in sales. This position allows individuals to earn a competitive salary while promoting eco-friendly initiatives.
    Find Solar Sales Representative jobs in Riverside, CA


  6. Physician Assistant
    Average Salary: $152,965
    Physician assistants support healthcare teams, directly impacting patient care and outcomes. Many healthcare providers in Riverside, including urgent care facilities, seek skilled assistants to enhance their services. The high demand for this role translates into attractive salaries and career advancement prospects.
    Find Physician Assistant jobs in Riverside, CA


  7. Nurse Practitioner
    Average Salary: $149,199
    Nurse practitioners deliver primary and specialty care, playing an essential role in the healthcare system. Local clinics and hospitals look for qualified individuals to help meet the needs of a growing population. This profession offers a chance to connect with patients while achieving a high earning potential.
    Find Nurse Practitioner jobs in Riverside, CA


  8. Pharmacist
    Average Salary: $133,771
    Pharmacists ensure patients receive the correct medications and understand their use. Many retail and hospital pharmacies in the area offer competitive salaries for skilled pharmacists. This role combines clinical knowledge with customer service, making it both essential and rewarding.
    Find Pharmacist jobs in Riverside, CA


  9. Director of Nursing
    Average Salary: $129,505
    Directors of nursing oversee nursing staff and ensure high-quality patient care in healthcare facilities. Local hospitals rely on these leaders to manage operations effectively and improve patient outcomes. With a strong focus on staff development and patient care, this role can be both challenging and fulfilling.
    Find Director of Nursing jobs in Riverside, CA


  10. Attorney
    Average Salary: $128,813
    Attorneys provide legal guidance to individuals and businesses, covering a wide spectrum of law. Local firms and solo practices in Riverside seek professionals to represent clients in various matters. This profession allows talented individuals to earn a strong income while advocating for justice.
    Find Attorney jobs in Riverside, CA

What are the best paying jobs in Riverside, CA without a degree?

Top paying jobs in Riverside, CA that do not require a degree include Outside Sales Representatives and Canvassers, earning average salaries of around $115,606 and $92,817, respectively. Other notable positions are Sales Inspectors and Concrete Finishers, which offer salaries of about $60,142 and $54,038. These roles provide strong earning potential and can lead to rewarding careers without the need for a formal degree.
Graph displaying best paying job salaries in Riverside, CA without a degree, highlighting Outside Sales Representative with the highest at $115,606 and Groundskeeper with the lowest at $40,856.
  1. Outside Sales Representative
    Average Salary: $115,606
    In this role, individuals build relationships with customers and promote products or services. Companies like ADP and Paychex seek talented sales representatives to drive growth. This role offers high earning potential through commission and bonuses.
    Find Outside Sales Representative jobs in Riverside, CA


  2. Canvasser
    Average Salary: $92,817
    Canvassers engage with potential customers to gather support for various causes or services. Local organizations and political campaigns need persuasive individuals to help drive their initiatives. Success in this job can lead to significant income based on performance.
    Find Canvasser jobs in Riverside, CA


  3. Sales Inspector
    Average Salary: $60,142
    Sales inspectors evaluate properties and products to ensure they meet quality standards before sale. Companies in the real estate and automotive industries rely on inspectors to maintain their reputation. This position offers steady work with opportunities for advancement.
    Find Sales Inspector jobs in Riverside, CA


  4. Concrete Finisher
    Average Salary: $54,038
    Concrete finishers shape and finish surfaces of poured concrete, ensuring high-quality results. Construction companies in Riverside often hire skilled tradespeople to work on various projects, from driveways to foundations. This role can lead to specialized positions and steady work.
    Find Concrete Finisher jobs in Riverside, CA


  5. Restaurant Manager
    Average Salary: $47,120
    Restaurant managers oversee daily operations, ensuring customer satisfaction and efficient service. Established chains and local eateries in Riverside often seek experienced managers to lead their teams. This position includes responsibilities like hiring, training, and maintaining a profitable operation.
    Find Restaurant Manager jobs in Riverside, CA


  6. Food Service Aide
    Average Salary: $46,107
    Food service aides assist with meal preparation and delivery in various settings, including hospitals and schools. Local facilities appreciate dedicated team members who ensure that meals are served promptly and safely. This position provides valuable experience in the food industry.
    Find Food Service Aide jobs in Riverside, CA


  7. Irrigation Technician
    Average Salary: $45,016
    Irrigation technicians install and maintain irrigation systems to support agriculture and landscaping. Companies focused on landscaping and farming in Riverside depend on these skilled workers to promote healthy plant growth. Opportunities for advancement exist as expertise in the field grows.
    Find Irrigation Technician jobs in Riverside, CA


  8. Meat Cutter
    Average Salary: $43,112
    Meat cutters prepare and package meat products for sale, focusing on quality and safety. Supermarkets and butcher shops in Riverside rely on skilled cutters to provide fresh, well-prepared products. This role can lead to further experience in food preparation and management.
    Find Meat Cutter jobs in Riverside, CA


  9. Recreation Assistant
    Average Salary: $42,607
    Recreation assistants help organize and lead recreational activities for community members. Local parks and recreation departments in Riverside seek energetic individuals to support programs for all ages. This role offers a chance to make a positive impact in the community.
    Find Recreation Assistant jobs in Riverside, CA


  10. Groundskeeper
    Average Salary: $40,856
    Groundskeepers maintain outdoor spaces, ensuring they are clean and attractive. Parks, golf courses, and schools in Riverside look for reliable individuals to care for their grounds. This position provides a sense of pride in keeping the community beautiful.
    Find Groundskeeper jobs in Riverside, CA

Which companies offer the top salaries in Riverside, CA?

LifeStance Health tops the list of the best-paying companies in Riverside, offering an impressive average salary of $211,273. Other notable employers include West Coast Dental Services and Children's Dental FunZone, with average salaries of $140,601 and $132,953, respectively. Riverside Community Hospital and Kaiser Permanente also provide competitive salaries, making these companies excellent choices for job seekers in the area.
Graph displaying company salaries in Riverside, CA, highlighting LifeStance Health with the highest at $211,273 and California Air Resources Board with the lowest at $95,813.
  1. LifeStance Health
    Average Salary: $211,273
    LifeStance Health provides mental health services, focusing on enhancing people's well-being.


  2. West Coast Dental Services
    Average Salary: $140,601
    West Coast Dental Services offers high-quality dental care and aims to keep patients' smiles healthy.


  3. Children's Dental FunZone
    Average Salary: $132,953
    Children's Dental FunZone specializes in pediatric dentistry and creates a fun atmosphere for kids.


  4. Riverside Community Hospital
    Average Salary: $123,854
    Riverside Community Hospital provides comprehensive healthcare services to local residents.


  5. RIVERSIDE COMMUNITY COLLEGE DISTRICT
    Average Salary: $112,019
    This district offers educational programs and services to support student success.


  6. CyberCoders
    Average Salary: $103,473
    CyberCoders specializes in recruiting and staffing for technology and engineering sectors.


  7. Kaiser Permanente
    Average Salary: $100,984
    Kaiser Permanente is a healthcare provider that focuses on preventive care and customer satisfaction.


  8. ProCare Therapy
    Average Salary: $100,562
    ProCare Therapy connects healthcare professionals with job opportunities in schools and clinics.


  9. ESP
    Average Salary: $99,140
    ESP offers educational support services and works to improve student learning experiences.


  10. California Air Resources Board
    Average Salary: $95,813
    This board focuses on air pollution control and ensuring clean air for all Californians.

How does the cost of living in Riverside, CA compare to the national average?

The cost of living index in Riverside, CA is 123, which is 23% higher than the nationwide average of 100. This suggests that living in Riverside can be more expensive, particularly in housing and transportation.
Cost of living comparison graph for Riverside, CA vs. Nationwide: housing 40% higher, groceries 10% higher, utilities 10% higher, transportation 20% higher, healthcare 5% higher, miscellaneous 15% higher.

Riverside, CA has a cost of living index that measures 115, which is 15% higher than the nationwide average of 100. This figure is important for job seekers considering a move to this vibrant city. One major contributor to the higher index is housing, which stands at 140. This means that housing costs in Riverside are 40% above the national average.


Other factors also play a role in Riverside's cost of living. Groceries and utilities index at 110 each, indicating costs that are 10% higher than the average. Transportation expenses are at 120, making it 20% more expensive to get around compared to the rest of the country. Additionally, healthcare costs are slightly above average at 105, while miscellaneous expenses hit 115. Understanding these costs can help job seekers better plan their move and lifestyle in Riverside.

Compare Salaries

What are other cities like?
Compare different cities.
Select a city
Thank you! Your submission has been received!
Oops! Something went wrong while submitting the form.
a hand paying employees
Allen, TX
The cost of living index in Allen, TX is 105, which is 5% higher than the nationwide average of 100. Residents can expect to spend more on housing, while groceries and healthcare remain under the national average.
Learn more
Altamonte Springs, FL
Altamonte Springs, FL has a cost of living index of 102, which is 2% higher than the nationwide average of 100. This means that while some expenses like housing are higher, others, such as groceries and transportation, cost less.
Learn more
Arlington, TX
The cost of living index in Arlington, TX is 98, which is 2% lower than the nationwide average of 100. This makes Arlington an attractive option for job seekers looking for affordability.
Learn more
Auburn, WA
Auburn, WA's overall cost of living index is 110, which is 10% higher than the nationwide average of 100. Housing in Auburn is particularly more expensive, with an index of 130, showing a 30% increase compared to the national average.
Learn more
Austin, TX
The cost of living index in Austin, TX is 112, which is 12% higher than the nationwide average of 100. Housing costs contribute significantly to this increase, ranking at 44% above the national average.
Learn more
Bakersfield, CA
Bakersfield, CA has a cost of living index of 98, which is 2% lower than the nationwide average of 100. This means residents can enjoy a more affordable lifestyle compared to many other places in the country.
Learn more
Bedford, TX
The cost of living index in Bedford, TX is 95, which is 5% lower than the nationwide average of 100. This means residents in Bedford enjoy a more affordable lifestyle compared to many other places in the country.
Learn more
Bellevue, WA
Bellevue, WA has a cost of living index of 158, which is 58% higher than the nationwide average of 100. This increase primarily stems from higher housing costs, making Bellevue a more expensive place to live compared to other areas.
Learn more
Boston, MA
The cost of living index in Boston, MA is 173.1 for housing, significantly higher than the nationwide average of 100. Overall, Boston's cost of living index stands at about 127.4, indicating that people can expect to spend roughly 27.4% more than the national average.
Learn more
Brandon, FL
Brandon, FL has a cost of living index of 95, which is 5% lower than the nationwide average of 100. This makes Brandon an affordable option for professionals seeking a good quality of life.
Learn more
Brockton, MA
Brockton, MA has a cost of living index of 106, which is 6% higher than the nationwide average of 100. This means that living expenses in Brockton are relatively higher than in many other places across the country.
Learn more
Brookline, MA
The cost of living index in Brookline, MA is 125, which is 25% higher than the nationwide average of 100. This indicates that residents may spend more on housing, groceries, and other essentials compared to most areas in the country.
Learn more
Burbank, CA
Burbank, CA has a cost of living index of 142, which is 42% higher than the nationwide average of 100. This means residents may pay significantly more for housing, groceries, utilities, and transportation compared to the average across the country.
Learn more
Cambridge, MA
Cambridge, MA has a cost of living index of 137.6, which is 37.6% higher than the nationwide average of 100. This indicates that living expenses in Cambridge are significantly above the typical costs found across the country.
Learn more
Cape Coral, FL
Cape Coral, FL has a cost of living index of 99, which is 1% lower than the nationwide average of 100. This means living in Cape Coral can be more affordable compared to many other places in the country.
Learn more
Carlsbad, CA
Carlsbad, CA has a cost of living index of 130.2, which is 30.2% higher than the nationwide average of 100. This indicates that residents may pay more for housing, groceries, and other expenses compared to the rest of the country.
Learn more
Carrollton, TX
The cost of living index in Carrollton, TX is 102, which is 2% higher than the nationwide average of 100. This suggests that while some expenses are above average, others like groceries and healthcare are below average, making it a balanced place to live.
Learn more
Cedar Park, TX
Cedar Park, TX has a cost of living index of 104, which is 4% higher than the nationwide average of 100. Housing costs are particularly high at 18% above the national average, while grocery prices are 7% lower.
Learn more
Chicopee, MA
Chicopee, MA has a cost of living index of 90, which is 10% lower than the nationwide average of 100. This makes Chicopee a more affordable option for professionals seeking work and a comfortable life.
Learn more
Chula Vista, CA
Chula Vista, CA has a cost of living index of 117, which is 17% higher than the nationwide average of 100. This means residents can expect to pay more for housing, groceries, and other everyday expenses.
Learn more
Cibolo, TX
Cibolo, TX has a cost of living index of 95, which is 5% lower than the nationwide average of 100. Residents enjoy lower housing, grocery, and transportation costs, helping to make life in Cibolo more affordable.
Learn more
Clearwater, FL
The cost of living index in Clearwater, FL is 97.7, which is 2.3% lower than the nationwide average of 100. This makes Clearwater an affordable option for those looking to relocate.
Learn more
Clovis, CA
Clovis, CA has a cost of living index of 110, which is 10% higher than the nationwide average of 100. Housing costs in Clovis are particularly high at 30% above the national average, while healthcare is 10% lower, offering some balance to expenses.
Learn more
Conroe, TX
Conroe, TX has a cost of living index of 92, which is 8% lower than the nationwide average of 100. This makes Conroe an affordable option for those looking to relocate without sacrificing quality of life.
Learn more
Coral Gables, FL
Coral Gables, FL has a cost of living index of 132.6, which is 32.6% higher than the nationwide average. This increase is mainly due to higher housing costs, while other categories like utilities and transportation remain close to the national average.
Learn more
Corona, CA
The cost of living index in Corona, CA is 122, which is 22% higher than the nationwide average of 100. This increase is mainly due to higher housing and transportation costs.
Learn more
Corpus Christi, TX
The cost of living index in Corpus Christi, TX is 86.5 for housing, which is 13.5% lower than the nationwide average. Overall, the city's cost of living is more affordable, with other categories like groceries and healthcare also below the national benchmark.
Learn more
Cupertino, CA
Cupertino, CA has a cost of living index of 142, which is 42% higher than the nationwide average of 100. This indicates that residents may face higher expenses for housing, groceries, and other necessities compared to the typical American city.
Learn more
Dallas, TX
The cost of living index in Dallas, TX is 98, which is 2% below the nationwide average of 100. This means living in Dallas can be more affordable compared to many other areas in the country.
Learn more
Davie, FL
The cost of living index in Davie, FL is 105, which is 5% higher than the nationwide average of 100. Housing costs significantly influence this index, sitting at 30% above the national average.
Learn more
Doral, FL
Doral, FL has a cost of living index of 103, which is 3% higher than the nationwide average of 100. This means people in Doral typically spend more on housing, groceries, and transportation compared to the national average.
Learn more
Downey, CA
The cost of living index in Downey, CA is 130, which is 30% higher than the nationwide average of 100. This means that residents may pay significantly more for housing, groceries, and other essentials compared to many other areas in the country.
Learn more
El Cajon, CA
El Cajon, CA has a cost of living index of 118, which is 18% higher than the nationwide average of 100. This means residents can expect to pay more for housing and related expenses compared to most other areas in the country.
Learn more
El Monte, CA
El Monte, CA has a cost of living index of 110, which is 10% higher than the nationwide average of 100. The housing costs significantly impact this, standing at 29% above the national average.
Learn more
El Paso, TX
El Paso, TX boasts a cost of living index of 86, which is 14% lower than the nationwide average of 100. This makes El Paso an affordable option for those looking to relocate.
Learn more
Elk Grove, CA
Elk Grove, CA has a cost of living index of 123, which is 23% higher than the nationwide average of 100. This means residents in Elk Grove may expect to pay more for housing, groceries, utilities, and other expenses compared to the national standard.
Learn more
Escondido, CA
Escondido, CA has a cost of living index of 120, which is 20% higher than the nationwide average of 100. This indicates that residents may spend more on housing, groceries, and utilities compared to other areas in the country.
Learn more
Euless, TX
The cost of living index in Euless, TX is 97, which is 3% lower than the nationwide average of 100. This means that living expenses in Euless are generally more affordable compared to other places in the country.
Learn more
Everett, WA
Everett, WA has a cost of living index of 106, which is 6% higher than the nationwide average of 100. This means residents may face higher expenses, particularly in housing and transportation.
Learn more
Fall River, MA
Fall River, MA has a cost of living index of 94, which is 6% lower than the national average of 100. This indicates that living in Fall River can be more affordable compared to many other parts of the country.
Learn more
Federal Way, WA
Federal Way, WA has a cost of living index of 110, which is 10% higher than the nationwide average of 100. Housing costs significantly drive this increase, with a housing index of 143, making it 43% higher than the national average.
Learn more
Fort Lauderdale, FL
The cost of living index in Fort Lauderdale, FL is 14% higher than the nationwide average, which is set at 100. Housing is the biggest factor, sitting at 30% above the national average.
Learn more
Fort Myers, FL
Fort Myers, FL has a cost of living index of 97, which is 3% lower than the nationwide average of 100. This makes it an affordable option compared to many other areas in the country.
Learn more
Fort Worth, TX
Fort Worth, TX has a cost of living index of 95, which is 5% lower than the nationwide average of 100. This means that living expenses such as housing, groceries, and utilities are more affordable in Fort Worth compared to the average across the country.
Learn more
Fresno, CA
Fresno, CA has a cost of living index of 100.2, which is slightly above the nationwide average of 100 by 0.2%. This means that living in Fresno is very close to the national standard, making it an appealing option for those seeking a balance between quality and cost of life.
Learn more
Frisco, TX
Frisco, TX has a cost of living index of 107, which is 7% higher than the nationwide average of 100. This reflects a moderate increase in expenses compared to other areas across the country.
Learn more
Garland, TX
Garland, TX has a cost of living index of 92, which is 8% lower than the nationwide average. This makes it an affordable option for professionals seeking job opportunities.
Learn more
Georgetown, TX
The cost of living index in Georgetown, TX is 4% lower than the nationwide average, which is set at 100. This makes Georgetown an affordable place for professionals looking to live and work.
Learn more
Glendale, CA
Glendale, CA has a cost of living index of 136, which is 36% higher than the nationwide average of 100. This increase is mainly driven by high housing costs, at 95% above the national average.
Learn more
Grand Prairie, TX
Grand Prairie, TX has a cost of living index of 95, which is 5% lower than the nationwide average of 100. This makes it a more affordable option compared to many other areas in the country.
Learn more
Hialeah, FL
Hialeah, FL has a cost of living index of 99, which is 1% lower than the nationwide average of 100. This makes Hialeah an affordable option compared to many other cities across the country.
Learn more
Hollywood, FL
Hollywood, FL has a cost of living index of 108, which is 8% higher than the nationwide average of 100. This means that living in Hollywood may be more expensive than in many other parts of the country.
Learn more
Houston, TX
Houston, TX has a cost of living index of 95, which is 5% lower than the nationwide average of 100. This makes it an attractive option for job seekers looking for affordable living expenses.
Learn more
Inglewood, CA
Inglewood, CA has a cost of living index of 120, which is 20% higher than the nationwide average of 100. This means that living in Inglewood can be more expensive compared to other areas in the country.
Learn more
Irving, TX
The cost of living index in Irving, TX is 98, which is 2% lower than the nationwide average of 100. This means residents enjoy a slightly more affordable lifestyle compared to many other areas in the country.
Learn more
Jacksonville, FL
Jacksonville, FL has a cost of living index of 96, which is 4% lower than the nationwide average of 100. This makes Jacksonville an affordable option for many people.
Learn more
Jurupa Valley, CA
The cost of living index in Jurupa Valley, CA is 114% of the nationwide average, which is set at 100. This means living in Jurupa Valley is moderately higher than the average across the country.
Learn more
Kent, WA
Kent, WA has a cost of living index of 110, which is 10% higher than the nationwide average of 100. This increase is mainly driven by higher housing costs, while other expenses like transportation and healthcare are below the national average.
Learn more
Kirkland, WA
Kirkland, WA has a cost of living index of 133, which is 33% higher than the nationwide average of 100. This increase is primarily driven by higher housing costs, which significantly contribute to the overall expenses in the area.
Learn more
Kissimmee, FL
Kissimmee, FL, has a cost of living index of 102. This means it is 2% higher than the nationwide average of 100.
Learn more
Kyle, TX
Kyle, TX has a cost of living index of 95, which is 5% lower than the nationwide average of 100. This means residents can enjoy a more affordable lifestyle compared to many other areas in the country.
Learn more
Lakewood, WA
Lakewood, WA has a cost of living index of 106, which is 6% higher than the nationwide average of 100. This means basic expenses like housing and groceries are relatively more expensive in Lakewood compared to many other areas in the country.
Learn more
Laredo, TX
Laredo, TX offers a cost of living index of 85.5, which is 14.5% lower than the nationwide average of 100. This makes it an affordable option for professionals seeking a lower cost of living.
Learn more
Largo, FL
The cost of living index in Largo, FL is 95.5% of the nationwide average, which is 100. This means living in Largo is generally more affordable, especially in housing, utilities, and transportation.
Learn more
Lawrence, MA
The cost of living index in Lawrence, MA is 97, which is 3% lower than the nationwide average of 100. This means that residents can enjoy a more affordable lifestyle compared to many other areas in the country.
Learn more
League City, TX
League City, TX, has a cost of living index of 96.8, which is 3.2% lower than the nationwide average of 100. This makes it an affordable place to live for many job seekers.
Learn more
Leander, TX
The cost of living index in Leander, TX is 101, which is just 1% higher than the nationwide average of 100. This means living in Leander is quite affordable, especially when considering lower grocery and utility costs.
Learn more
Long Beach, CA
The cost of living index in Long Beach, CA, is 13% higher than the nationwide average of 100, standing at 113. This increase reflects higher costs in categories like housing, groceries, and transportation.
Learn more
Los Angeles, CA
Los Angeles has a cost of living index of 138, which is 38% higher than the nationwide average of 100. This increase is largely driven by high housing costs, making it important for job seekers to consider their budget when relocating.
Learn more
Lowell, MA
Lowell, MA has a cost of living index of 107, which is 7% higher than the nationwide average of 100. This means that living in Lowell may be more expensive, particularly in areas like housing and groceries, but transportation costs are below average.
Learn more
Lynn, MA
Lynn, MA has a cost of living index of 106, which is 6% higher than the nationwide average of 100. This shows that while housing and groceries cost more, other expenses like utilities are more affordable in Lynn.
Learn more
Malden, MA
Malden, MA has a cost of living index of 113, which is 13% higher than the nationwide average of 100. This reflects higher housing, grocery, and transportation costs, while healthcare remains lower than the national average.
Learn more
Mansfield, TX
Mansfield, TX, has a cost of living index of 93, which is 7% lower than the nationwide average of 100. This lower index means residents can enjoy more affordable housing, groceries, and utilities compared to many other areas in the country.
Learn more
Marysville, WA
Marysville, WA has a cost of living index of 110, which is 10% higher than the nationwide average of 100. This means residents can expect to pay more, particularly for housing and transportation.
Learn more
McKinney, TX
McKinney, TX has a cost of living index of 100, which is on par with the nationwide average. Housing costs are slightly higher at 104, while groceries, utilities, healthcare, and transportation are below the average, helping to balance overall living expenses.
Learn more
Medford, MA
Medford, MA has a cost of living index of 114, which is 14% higher than the nationwide average of 100. This indicates that living in Medford requires a higher budget compared to many other areas across the country.
Learn more
Mesquite, TX
The cost of living index in Mesquite, TX is 94, which is 6% lower than the nationwide average of 100. This makes it a more affordable option for those looking to move for job opportunities.
Learn more
Miami Beach, FL
Miami Beach has a cost of living index of 134, which is 34% higher than the nationwide average of 100. This increase is mainly due to high housing costs and expenses in groceries and miscellaneous items.
Learn more
Miami Gardens, FL
Miami Gardens, FL has a cost of living index of 105, which is 5% higher than the nationwide average of 100. This means overall living expenses, including housing and groceries, are slightly elevated compared to other areas in the country.
Learn more
Miami, FL
The cost of living index in Miami, FL is 23% higher than the nationwide average, which stands at 100. This difference means housing and groceries are particular areas where costs significantly exceed the national levels.
Learn more
Milpitas, CA
Milpitas, CA has a higher cost of living index compared to the nationwide average, which stands at 100. Specifically, its overall index is approximately 205%, making it significantly more expensive, especially in areas like housing and groceries.
Learn more
Miramar, FL
Miramar, FL has a cost of living index of 103, which is 3% higher than the nationwide average of 100. This means residents may expect to pay a bit more for housing, groceries, and transportation compared to the average American city.
Learn more
Moreno Valley, CA
The cost of living index in Moreno Valley, CA, is 113, which is 13% higher than the nationwide average of 100. This increase reflects higher housing and transportation costs compared to many other places in the U.S.
Learn more
National City, CA
National City, CA has a cost of living index of 119, which is 19% higher than the nationwide average of 100. This means residents can expect to pay more for housing, groceries, and transportation compared to other parts of the country.
Learn more
New Bedford, MA
The cost of living index in New Bedford, MA is 98, which is 2% lower than the nationwide average of 100. This means New Bedford offers a more affordable lifestyle in comparison to many other areas across the country.
Learn more
New Braunfels, TX
New Braunfels, TX has a cost of living index of 93, which is 7% lower than the nationwide average of 100. This makes it an affordable option for those looking to relocate or job seekers aiming for a better quality of life.
Learn more
Newton, MA
The cost of living index in Newton, MA is 183, which is 83% higher than the nationwide average of 100. This indicates that housing and other expenses in Newton are significantly above average.
Learn more
North Miami, FL
North Miami, FL has a cost of living index of 106, which is 6% higher than the nationwide average of 100. This means residents pay more for housing, groceries, and transportation, while utilities and healthcare costs are lower.
Learn more
North Richland Hills, TX
North Richland Hills, TX has a cost of living index of 95, which is 5% lower than the nationwide average of 100. This lower index reflects more affordable housing and grocery costs in the area.
Learn more
Orlando, FL
The cost of living index in Orlando, FL is 104, which is 4% higher than the nationwide average of 100. Housing costs significantly influence this increase, sitting at 12% above the national average.
Learn more

There are 2,388 job openings in Riverside, CA, today!

Take a deeper dive into the job market in Riverside, CA

Discover what it's like to work in Riverside, CA. Learn if you need a car, explore popular employers, the job market, and the best neighborhoods to live in.

City
Overview
Riverside, CA
2,388 job openings