Salaries in Santa Clara, CA

Updated on Mar 08, 2025
City
Salary

What is the average salary in Santa Clara, CA?

The average salary in Santa Clara, CA is $120,142 per year.

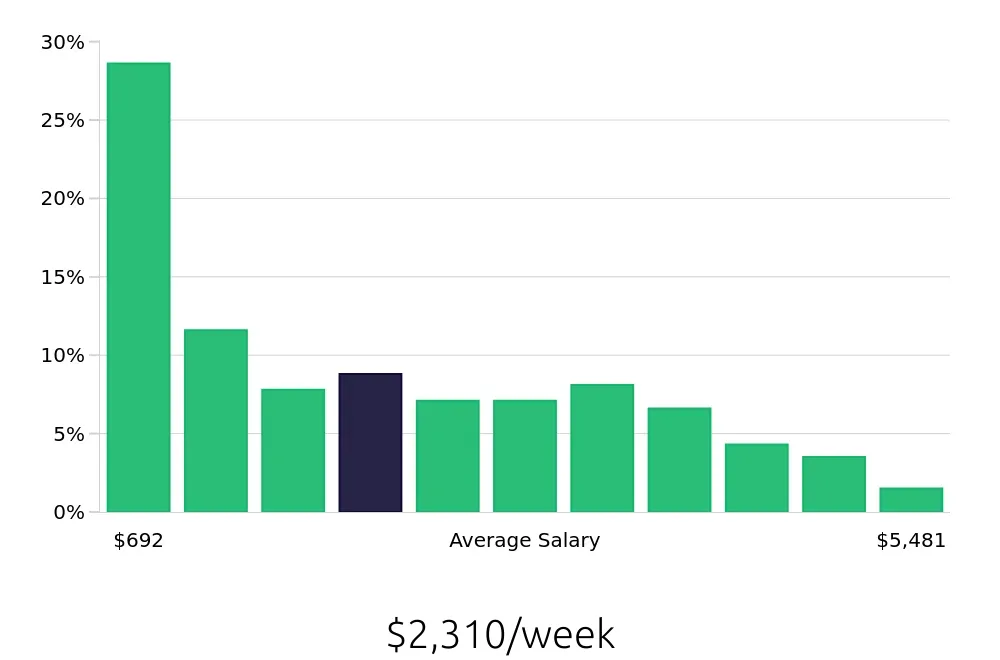
In Santa Clara, CA, the job market offers a wide range of salaries, reflecting various levels of experience and job types. The average yearly salary stands at an impressive $120,142. This amount highlights the demand for skilled professionals in the area.


Looking closer at the salary distribution, about 28.6% of workers earn around $36,000 per year. As experience increases, so do the salaries. For example, 11.6% of jobs offer a salary of approximately $58,636. Around 7.8% of the workforce earns about $81,273, while 8.8% receive $103,909 annually.


Higher salaries are available for those with more experience. About 7.1% of jobs pay $126,545, and another 7.1% offer $149,182. Those in the upper salary brackets can earn significantly more, with 8.1% bringing in $171,818. The figures indicate a rich array of career paths with strong earning potential.


The highest salaries show even greater opportunities. About 6.6% of jobs pay $194,455, while 4.3% offer $217,091. The top 3.5% of earners receive $239,727 or more, reaching salaries as high as $262,364 and even $285,000. These amounts reveal the potential for significant income in Santa Clara.


Job seekers can feel encouraged by the competitive salary landscape in Santa Clara. With a focus on professional growth, many career opportunities exist to achieve well above average yearly earnings.

View Jobs in Santa Clara, CA

What are the best paying jobs in Santa Clara, CA?

The best paying jobs in Santa Clara, CA, offer impressive salaries that reflect the high demand for skilled professionals. Positions such as Principal Engineer and Solution Architect lead the way, with average salaries exceeding $217,000. Other top roles include Machine Learning Engineer and Technical Programs Manager, both offering substantial compensation. This thriving job market values expertise and innovation, making it an excellent place for career growth.
Graph displaying best paying job salaries in Santa Clara, CA, highlighting Principal Engineer with the highest at $220,626 and Firmware Engineer with the lowest at $187,964.
  1. Principal Engineer
    Average Salary: $220,626
    This role involves leading engineering projects and managing teams in innovative tech companies. Professionals focus on developing advanced technologies, often for firms like Apple and Intel. The position requires technical expertise and strong leadership skills.
    Find Principal Engineer jobs in Santa Clara, CA


  2. Solution Architect
    Average Salary: $217,849
    This position involves designing and implementing software solutions that meet client needs. Professionals work closely with stakeholders to create effective architecture, often for companies like Cisco and VMware. They require a mix of technical knowledge and communication skills.
    Find Solution Architect jobs in Santa Clara, CA


  3. Solutions Architect
    Average Salary: $215,318
    In this role, individuals craft solutions that align technology and business goals. They collaborate with various teams to ensure the software meets user requirements, with firms such as Google and Oracle as potential employers. Strong technical and problem-solving skills are essential.
    Find Solutions Architect jobs in Santa Clara, CA


  4. Architect
    Average Salary: $204,197
    This job focuses on developing plans and designs for large-scale projects, often in tech and engineering sectors. Professionals work with teams to ensure technical feasibility, often with organizations like Amazon and Nvidia. It requires creativity and a deep understanding of engineering principles.
    Find Architect jobs in Santa Clara, CA


  5. Machine Learning Engineer
    Average Salary: $203,777
    In this position, professionals design and implement machine learning algorithms to analyze data and improve products. They work for leading companies, developing cutting-edge technologies in AI and data science. Strong programming and analytical skills are crucial for success.
    Find Machine Learning Engineer jobs in Santa Clara, CA


  6. Research Associate
    Average Salary: $196,848
    This role involves conducting experiments and analyzing data to support research initiatives. Professionals often work at biotech or tech companies, contributing to advancements in various fields. Attention to detail and strong analytical skills are important.
    Find Research Associate jobs in Santa Clara, CA


  7. DevOps Engineer
    Average Salary: $195,874
    In this position, individuals enhance software development and IT operations to improve efficiency. They often collaborate with teams at companies like Adobe and Cisco to streamline processes. Strong knowledge of automation tools and coding is key to success.
    Find DevOps Engineer jobs in Santa Clara, CA


  8. Integration Engineer
    Average Salary: $195,300
    This role focuses on connecting various systems and ensuring they work seamlessly together. Professionals often work with companies in tech, providing solutions for integration issues. Technical skills in software and system architecture are essential.
    Find Integration Engineer jobs in Santa Clara, CA


  9. Technical Programs Manager
    Average Salary: $192,116
    This position requires overseeing technical projects and managing cross-functional teams to meet deadlines. Professionals work with leading tech firms, ensuring projects align with business objectives. Strong organizational and communication skills are vital.
    Find Technical Programs Manager jobs in Santa Clara, CA


  10. Firmware Engineer
    Average Salary: $187,964
    In this role, individuals design and develop software that directly interacts with hardware. They often collaborate with companies in sectors like consumer electronics and telecommunications. A strong understanding of both software coding and electronic principles is necessary.
    Find Firmware Engineer jobs in Santa Clara, CA

What are the best paying jobs in Santa Clara, CA without a degree?

In Santa Clara, some of the best-paying jobs that don’t require a degree include positions like Restaurant Manager, offering an average salary of about $79,449, and Recreation Assistant, with an average salary around $61,737. Other rewarding options include roles such as Line Cook and Server, which also provide competitive pay.
Graph displaying best paying job salaries in Santa Clara, CA without a degree, highlighting Restaurant Manager with the highest at $79,449 and Service Team Member with the lowest at $41,803.
  1. Restaurant Manager
    Average Salary: $79,449
    In this role, managers oversee daily operations in dining establishments. They ensure excellent customer service while managing staff and inventory. Companies in Santa Clara often look for individuals who can handle both the front and back of house efficiently.
    Find Restaurant Manager jobs in Santa Clara, CA


  2. Recreation Assistant
    Average Salary: $61,737
    Recreation assistants help organize and facilitate community activities, often working for local parks or recreation centers. They plan events and provide support to ensure participants have an enjoyable experience. This position suits those who enjoy working with the public and promoting healthy activities.
    Find Recreation Assistant jobs in Santa Clara, CA


  3. To Go Specialist
    Average Salary: $59,234
    A To Go Specialist manages takeout orders and ensures food is packaged accurately and efficiently. This role typically exists in restaurants with a strong focus on takeout services. Individuals in this position contribute to customer satisfaction through their attention to detail.
    Find To Go Specialist jobs in Santa Clara, CA


  4. Server Assistant
    Average Salary: $50,927
    Server assistants support waitstaff by delivering food, refilling drinks, and clearing tables. They play a crucial role in enhancing the dining experience by maintaining a clean and welcoming environment. Local restaurants appreciate workers who can thrive in fast-paced settings.
    Find Server Assistant jobs in Santa Clara, CA


  5. Housekeeping
    Average Salary: $47,835
    Housekeepers maintain cleanliness in hotels, offices, or private residences. They perform tasks such as cleaning rooms and managing laundry. This job requires attention to detail and a commitment to providing a clean and safe environment for guests.
    Find Housekeeping jobs in Santa Clara, CA


  6. Floor Tech
    Average Salary: $45,577
    Floor technicians specialize in cleaning and maintaining various surfaces in commercial buildings. They operate equipment to strip, wax, and polish floors, ensuring that spaces remain presentable. Businesses in Santa Clara rely on skilled workers to uphold cleanliness standards.
    Find Floor Tech jobs in Santa Clara, CA


  7. Server
    Average Salary: $44,217
    Servers take customer orders, deliver food, and provide great service in dining establishments. They must be knowledgeable about the menu and able to handle multiple tasks simultaneously. Restaurants appreciate dependable individuals who can enhance the guest experience.
    Find Server jobs in Santa Clara, CA


  8. Yard Worker
    Average Salary: $43,820
    Yard workers perform maintenance tasks in outdoor settings, including landscaping, planting, and garden care. They work for organizations that manage parks, golf courses, or private properties. This role offers a chance to enjoy fresh air while keeping spaces beautiful.
    Find Yard Worker jobs in Santa Clara, CA


  9. Line Cook
    Average Salary: $43,427
    Line cooks prepare and cook food in restaurant kitchens, following recipes and presentation standards. They often work at busy establishments and must be quick and organized. Companies value cooks who can help create delicious meals for customers.
    Find Line Cook jobs in Santa Clara, CA


  10. Service Team Member
    Average Salary: $41,803
    Service team members engage with customers and assist in various roles within a service-oriented business. They might handle cash registers, food service, or customer inquiries. Many businesses in Santa Clara seek friendly, efficient staff to support their operations.
    Find Service Team Member jobs in Santa Clara, CA

Which companies offer the top salaries in Santa Clara, CA?

NVIDIA stands out as the highest paying company in Santa Clara, with an average salary of $217,910. Other top earners include Oski Technology and Apple, offering average salaries of $211,709 and $207,573, respectively. Professionals seeking competitive salaries will find strong opportunities within these leading companies.
Graph displaying company salaries in Santa Clara, CA, highlighting NVIDIA with the highest at $217,910 and Intel Corporation with the lowest at $171,141.
  1. NVIDIA
    Average Salary: $217,910
    NVIDIA is a leading technology company, widely known for its graphics processing units and AI systems.


  2. Oski Technology
    Average Salary: $211,709
    Oski Technology specializes in innovative semiconductor solutions and offers services to enhance digital designs.


  3. Apple
    Average Salary: $207,573
    Apple is a globally recognized brand known for its innovative consumer electronics and software.


  4. Qualcomm
    Average Salary: $203,706
    Qualcomm leads in wireless technology and develops solutions for mobile communications.


  5. Pure Storage
    Average Salary: $203,537
    Pure Storage focuses on data storage solutions, helping businesses manage and protect their data efficiently.


  6. d-Matrix
    Average Salary: $202,904
    d-Matrix provides advanced AI infrastructure aimed at accelerating deep learning systems.


  7. ServiceNow
    Average Salary: $199,737
    ServiceNow offers cloud-based solutions that streamline enterprise operations and improve IT services.


  8. Palo Alto Networks
    Average Salary: $193,125
    Palo Alto Networks safeguards organizations with its cutting-edge cybersecurity technology.


  9. Ampere Computing
    Average Salary: $174,670
    Ampere Computing designs processors that power cloud and data center solutions, focusing on energy-efficiency.


  10. Intel Corporation
    Average Salary: $171,141
    Intel is a cornerstone in computing and technology, producing processors that power a wide range of devices.

How does the cost of living in Santa Clara, CA compare to the national average?

Santa Clara, CA has a cost of living index of 145, which is 45% higher than the nationwide average of 100. This means living in Santa Clara can be more expensive, particularly for housing and groceries.
Cost of living comparison graph for Santa Clara, CA vs. Nationwide: housing 176% higher, groceries 30% higher, utilities 4% higher, transportation 35% higher, healthcare 5% higher, miscellaneous 15% higher.

Santa Clara, CA, has a cost of living index that stands at 192, which is 92% higher than the nationwide average of 100. Housing significantly contributes to this high index, with a housing cost of 276. This indicates that housing in Santa Clara is 176% more expensive than the average across the country. For job seekers moving to the area, understanding this cost is vital when budgeting for expenses.


Other essential costs also show an increase compared to the national average. Groceries in Santa Clara are 30% higher than average, with a grocery index of 130. Transportation costs are similarly elevated, at 135, which is 35% above the national norm. Even utilities and healthcare are pricier, with indexes of 104 and 105 respectively. While the higher cost of living in Santa Clara may seem daunting, many find the area's job opportunities and lifestyle worth the expense.

Compare Salaries

What are other cities like?
Compare different cities.
Select a city
Thank you! Your submission has been received!
Oops! Something went wrong while submitting the form.
a hand paying employees
Pasadena, CA
The cost of living index in Pasadena, CA is 96% higher than the nationwide average, which is set at 100. This significant increase mainly comes from elevated housing costs and transportation expenses.
Learn more
Pasadena, TX
Pasadena, TX has a cost of living index of 92, which is 8% lower than the nationwide average of 100. This means residents enjoy lower costs in housing, groceries, and transportation compared to other areas in the country.
Learn more
Pearland, TX
The cost of living index in Pearland, TX is 98, which is 2% lower than the nationwide average of 100. This means that living in Pearland can be more affordable compared to many other areas in the country.
Learn more
Pembroke Pines, FL
Pembroke Pines, FL has a cost of living index of 107, which is 7% higher than the nationwide average of 100. The most significant factor is housing, at 125, making it relatively more expensive in this category.
Learn more
Pflugerville, TX
Pflugerville, TX has a cost of living index of 93, which is 7% lower than the nationwide average of 100. This makes Pflugerville a more affordable option for professionals seeking a balanced lifestyle.
Learn more
Pinellas Park, FL
Pinellas Park, FL has a cost of living index of 96, which is 4% lower than the nationwide average of 100. This makes it an affordable option compared to many other areas in the country.
Learn more
Plano, TX
The cost of living index in Plano, TX is 103, which is 3% higher than the nationwide average of 100. Most categories, like housing at 9% above average, contribute to this increase while groceries and healthcare remain below the national average.
Learn more
Plantation, FL
Plantation, FL has a cost of living index of 103, which is 3% higher than the nationwide average of 100. This means living in Plantation is a bit more expensive than the average across the United States.
Learn more
Pomona, CA
The cost of living index in Pomona, CA is 115, which is 15% higher than the nationwide average of 100. This means residents may expect to pay more for housing, groceries, utilities, transportation, and healthcare compared to other areas in the country.
Learn more
Pompano Beach, FL
Pompano Beach, FL has a cost of living index of 102. This is 2% higher than the nationwide average of 100.
Learn more
Puyallup, WA
Puyallup, WA has a cost of living index of 102.5, which is 2.5% higher than the nationwide average of 100. This indicates that living in Puyallup is slightly more expensive than the average U.S. city.
Learn more
Quincy, MA
Quincy, MA has a cost of living index of 117, which is 17% higher than the nationwide average of 100. Housing costs lead the way, being 30% higher than average, while healthcare remains on par with the national figures.
Learn more
Rancho Cordova, CA
The cost of living index in Rancho Cordova, CA is 119, which is 19% higher than the nationwide average of 100. This means that living expenses in Rancho Cordova can be higher, especially in areas like housing and groceries.
Learn more
Redmond, WA
Redmond, WA has a cost of living index of 130, which is 30% higher than the nationwide average of 100. This means that living in Redmond is more expensive, particularly in housing and miscellaneous expenses.
Learn more
Renton, WA
The cost of living index in Renton, WA is 108, which is 8% higher than the nationwide average of 100. This means residents pay more for housing and groceries but benefit from lower utility costs compared to the national average.
Learn more
Richardson, TX
Richardson, TX has a cost of living index of 99, which is 1% below the nationwide average of 100. This means living in Richardson is slightly more affordable, especially in areas like housing and transportation.
Learn more
Riverside, CA
The cost of living index in Riverside, CA is 123, which is 23% higher than the nationwide average of 100. This suggests that living in Riverside can be more expensive, particularly in housing and transportation.
Learn more
Roseville, CA
The cost of living index in Roseville, CA is 114, indicating it is 14% higher than the nationwide average of 100. This reflects higher housing, grocery, and transportation costs compared to most other places in the country.
Learn more
Round Rock, TX
Round Rock, TX has a cost of living index of 94, which is 6% lower than the nationwide average of 100. This makes it an affordable option for those looking to relocate.
Learn more
Sacramento, CA
Sacramento, CA has a cost of living index of 117, which is 17% higher than the nationwide average of 100. This increase reflects higher housing and utility costs, making Sacramento more expensive than many other cities in the U.S.
Learn more
Sammamish, WA
Sammamish, WA has a cost of living index of 145.1, which is 45.1% higher than the nationwide average of 100. This difference highlights the relatively higher expenses residents face in housing, groceries, and other categories compared to most places in the country.
Learn more
San Antonio, TX
San Antonio, TX has a cost of living index of 92, which is 8% lower than the nationwide average of 100. This makes San Antonio an affordable option for those looking to live in a large city.
Learn more
San Diego, CA
San Diego, CA, has a cost of living index of 132, which is 32% higher than the nationwide average of 100. This increase reflects higher expenses in housing, groceries, and transportation compared to other areas in the country.
Learn more
San Jose, CA
San Jose, CA has a cost of living index of 134.2, which is 34.2% higher than the nationwide average of 100. This makes it important for job seekers to consider the higher expenses when looking for positions in this city.
Learn more
San Marcos, CA
San Marcos, CA has a cost of living index of 115, which is 15% higher than the nationwide average of 100. This means residents can expect to pay more for housing, groceries, and other expenses compared to the rest of the country.
Learn more
San Marcos, TX
San Marcos, TX has a cost of living index of 94.6, which is 5.4% lower than the nationwide average of 100. This lower index means that living expenses in San Marcos are generally more affordable than the national standard.
Learn more
Sanford, FL
The cost of living index in Sanford, FL is 7% lower than the nationwide average, which is set at 100. This offers residents an affordable lifestyle compared to many other areas in the country.
Learn more
Santa Clarita, CA
The cost of living index in Santa Clarita, CA is 130%, which is 30% higher than the nationwide average of 100. Housing costs make up the biggest difference, sitting at 70% above the national average.
Learn more
Schertz, TX
Schertz, TX has a cost of living index of 93.9, which is 6.1% lower than the nationwide average of 100. This makes Schertz an affordable option for those considering relocation.
Learn more
Seattle, WA
Seattle, WA has a cost of living index of 121. This is 21% higher than the nationwide average of 100.
Learn more
Shoreline, WA
Shoreline, WA has a cost of living index of 115, which is 15% higher than the nationwide average of 100. This means residents may spend more on housing, groceries, and transportation compared to the rest of the country.
Learn more
Somerville, MA
Somerville, MA has a cost of living index of 130.8, which is 30.8% higher than the nationwide average of 100. While housing costs are significantly above average at 58.5% more, other categories like groceries and healthcare also show higher expenses.
Learn more
Spokane Valley, WA
Spokane Valley, WA has a cost of living index of 95, which is 5% lower than the nationwide average of 100. This means housing, groceries, and transportation are more affordable, making it an attractive option for job seekers.
Learn more
Spokane, WA
Spokane, WA has a cost of living index of 95, which is 5% lower than the nationwide average of 100. This makes it an affordable option for those looking to relocate while pursuing job opportunities.
Learn more
Springfield, MA
Springfield, MA has a cost of living index of 91, which is 9% lower than the nationwide average of 100. This means residents enjoy lower housing and living costs compared to many other areas in the country.
Learn more
Sugar Land, TX
The cost of living index in Sugar Land, TX stands at 103, which is 3% higher than the nationwide average of 100. Housing costs are notably higher at 17%, while groceries and transportation are below average.
Learn more
Sunnyvale, CA
The cost of living index in Sunnyvale, CA is 157, which is 57% higher than the nationwide average of 100. This means residents face higher expenses for housing, groceries, and other necessities compared to most other areas in the country.
Learn more
Tacoma, WA
The cost of living index in Tacoma, WA is 115, which is 15% higher than the nationwide average of 100. This increase mainly comes from higher housing and transportation costs.
Learn more
Tallahassee, FL
The cost of living index in Tallahassee, FL is 92.5, which is 7.5% lower than the nationwide average of 100. This makes Tallahassee an affordable option for those considering relocation.
Learn more
Tampa, FL
Tampa, FL has a cost of living index of 100.6, which is slightly above the nationwide average of 100, indicating a more affordable cost for housing, utilities, and healthcare compared to other areas in the country.
Learn more
The Colony, TX
The cost of living index in The Colony, TX is 1% below the nationwide average, scoring 99 overall. This means residents enjoy a more affordable lifestyle compared to many other parts of the country.
Learn more
The Woodlands, TX
The Woodlands, TX, has a cost of living index of 98, which is 2% lower than the nationwide average of 100. This makes it a more affordable option for professional job seekers looking to relocate.
Learn more
Torrance, CA
Torrance, CA has a cost of living index of 130, which is 30% higher than the nationwide average of 100. This reflects increased costs in housing, groceries, and transportation compared to other areas across the country.
Learn more
Tukwila, WA
Tukwila, WA has a cost of living index of 106, which is 6% higher than the nationwide average of 100. Housing costs are notably higher at 32% above average, while utilities remain lower than average at 2% less.
Learn more
Vancouver, WA
Vancouver, WA has a cost of living index of 106, which is 6% higher than the nationwide average of 100. This indicates that living in Vancouver is relatively more expensive than the average in the U.S.
Learn more
Vista, CA
The cost of living index in Vista, CA is 118.4, which is 18.4% higher than the nationwide average of 100. This highlights the higher expenses residents can expect in housing, groceries, and healthcare compared to other parts of the country.
Learn more
Westfield, MA
The cost of living index in Westfield, MA stands at 99, which is 1% lower than the nationwide average of 100. This means that overall, living in Westfield is slightly more affordable compared to the national level.
Learn more
Weston, FL
Weston, FL has a cost of living index of 115, which is 15% higher than the nationwide average of 100. This increase is mainly driven by higher housing costs, which are 40% above the national average.
Learn more
Worcester, MA
Worcester, MA has a cost of living index of 94, which is 6% lower than the nationwide average of 100. This lower index indicates that living expenses in Worcester are generally more affordable compared to many other places in the country.
Learn more

There are 2,110 job openings in Santa Clara, CA, today!

Take a deeper dive into the job market in Santa Clara, CA

Discover what it's like to work in Santa Clara, CA. Learn if you need a car, explore popular employers, the job market, and the best neighborhoods to live in.

City
Overview
Santa Clara, CA
2,110 job openings